By John Golden, Chief Strategy and Marketing Officer at Pipeliner CRM

Did you know that 90% of information transmitted to the brain is visual? It makes sense when you consider that the human brain processes images 60,000 times faster than text. This is precisely why we built Pipeliner CRM to be the most visual CRM available on the market. In Sales, time is always of the essence so we want to make every second count.

Plus today’s selling environment continues to become more complex with so much data being thrown at salespeople that it can become overwhelming – this is why we have applied the “Science of Simplification” better known as Cybernetics.

The originator of the science of cybernetics was American mathematician and philosopher Norbert Wiener. In 1948 he defined cybernetics as “the scientific study of control and communication in the animal and the machine.” The word cybernetics comes from Greek κυβερνητική (kybernetike), meaning “governance”, the latter meaning “to steer, navigate or govern”. W. Ross Ashby referred to cybernetics as the “science of simplification”.

If there is one thing that salespeople don’t need more of and that is unnecessary complexity but that is exactly what they have been presented with when traditional command and control CRM systems are foisted upon them. In contrast, we at Pipeliner take a “sales-eye” view and always look at how we can present critical sales data in the most simple and visual format for busy salespeople can process it in the blink of an eye.

To make learning and adopting Pipeliner as easy and fast as possible we have created a uniform layout and navigation for viewing the details of the most critical elements of every sales process: Accounts, Contacts, Leads, and Opportunities. But more than that, we offer multiple ways of viewing the same data so that users can choose how best they want to display it – no other system is so flexible and understands that different people process data in different ways. Plus we use graphs, icons, and charts everywhere throughout the system allowing the salesperson, with one quick glance, to see the information they need.

In other words, we do the hard work of figuring out how to present data to make it easy for the salesperson to process it quickly and use it immediately. With today’s technology it is pretty easy to gather copious amounts of data and while this has its obvious advantages there are real limitations in how much data the human brain can consume at once.

You have heard the expression “drinking from a fire hose” when overloaded with information and this mistake is replicated by many of the systems that salespeople are forced to use. In contrast, we take the fire hose and turn the torrent of water in beautiful watercolor paintings!

This is what we call Dynamic, Instant Visualization!

Our team was in New York recently meeting with The Board of a prospect organization. Winter has arrived, and we send our holiday greetings from the 60th floor overlooking the Hudson River and Central Park.

As we approach the end of 2019, it’s time to look forward to the year ahead—starting with an assessment of your sales team’s performance over the past year. How did they do? Where do the need to improve?

More importantly, how do you measure their performance so you can answer those questions?

To remove the subjectivity and help you take a quantitative approach in evaluating your team, we’ve developed a list of questions that get at the answers. Use the questions to distinguish the producers from the laggards. And use these questions to determine which skills your salespeople need to improve on in order to meet and exceed goals.

Also see if you can match the question posed with the corresponding sales skill. (You’ll find the answers at the end of this article.)

Questions for quantitatively measuring sales performance:

  1. How many of the qualified opportunities in your current sales pipeline were initiated by the seller?
  2. What title(s) most commonly appears in the field for primary point of contact? Is that a decision maker’s title?
  3. How well matched are your company’s product or service capabilities with the prospect’s business objectives?
  4. What value (outside of product/price) will the prospect’s organization be able to identify while working with your company?
  5. How much research does a prospect do before engaging with a salesperson?
  6. Who on your sales team held the margin line in the negotiations, and who caved to the buyer’s pressure?

In addition to answering these questions, also evaluate your team individually. How well can the individuals on your teams execute each skill? By using the questions above, managers can identify who has which skills and where improvement is needed. This is how your qualitative analysis of skills can be analyzed in relation to the quantitative assessment.

Here’s an example of the kind of insight you can gain: We worked with a company that calculated the cost of every sales call to be $400.00. They discovered that many of the calls were to prospects who would never produce enough revenue to cover the cost of the calls made. The managers were then tasked to analyze how well the reps could execute each step, and then identify where coaching was needed. As a result, the reps’ overall skills improved, the amount of time spent on the wrong prospects was reduced, and revenue results increased with fewer overall calls being made. In essence, the focus is on the quality of the calls versus the quantity of calls conducted. All because they took a quantitative approach using these questions.

And as promised, here are the skills that match each question above: 1) New Business Development 2) Accessing Key Players 3) Qualification and Positioning 4) Establishing Value 5) Opportunity Management/Forecasting 6) Negotiation.

zp8497586rq

great teaam
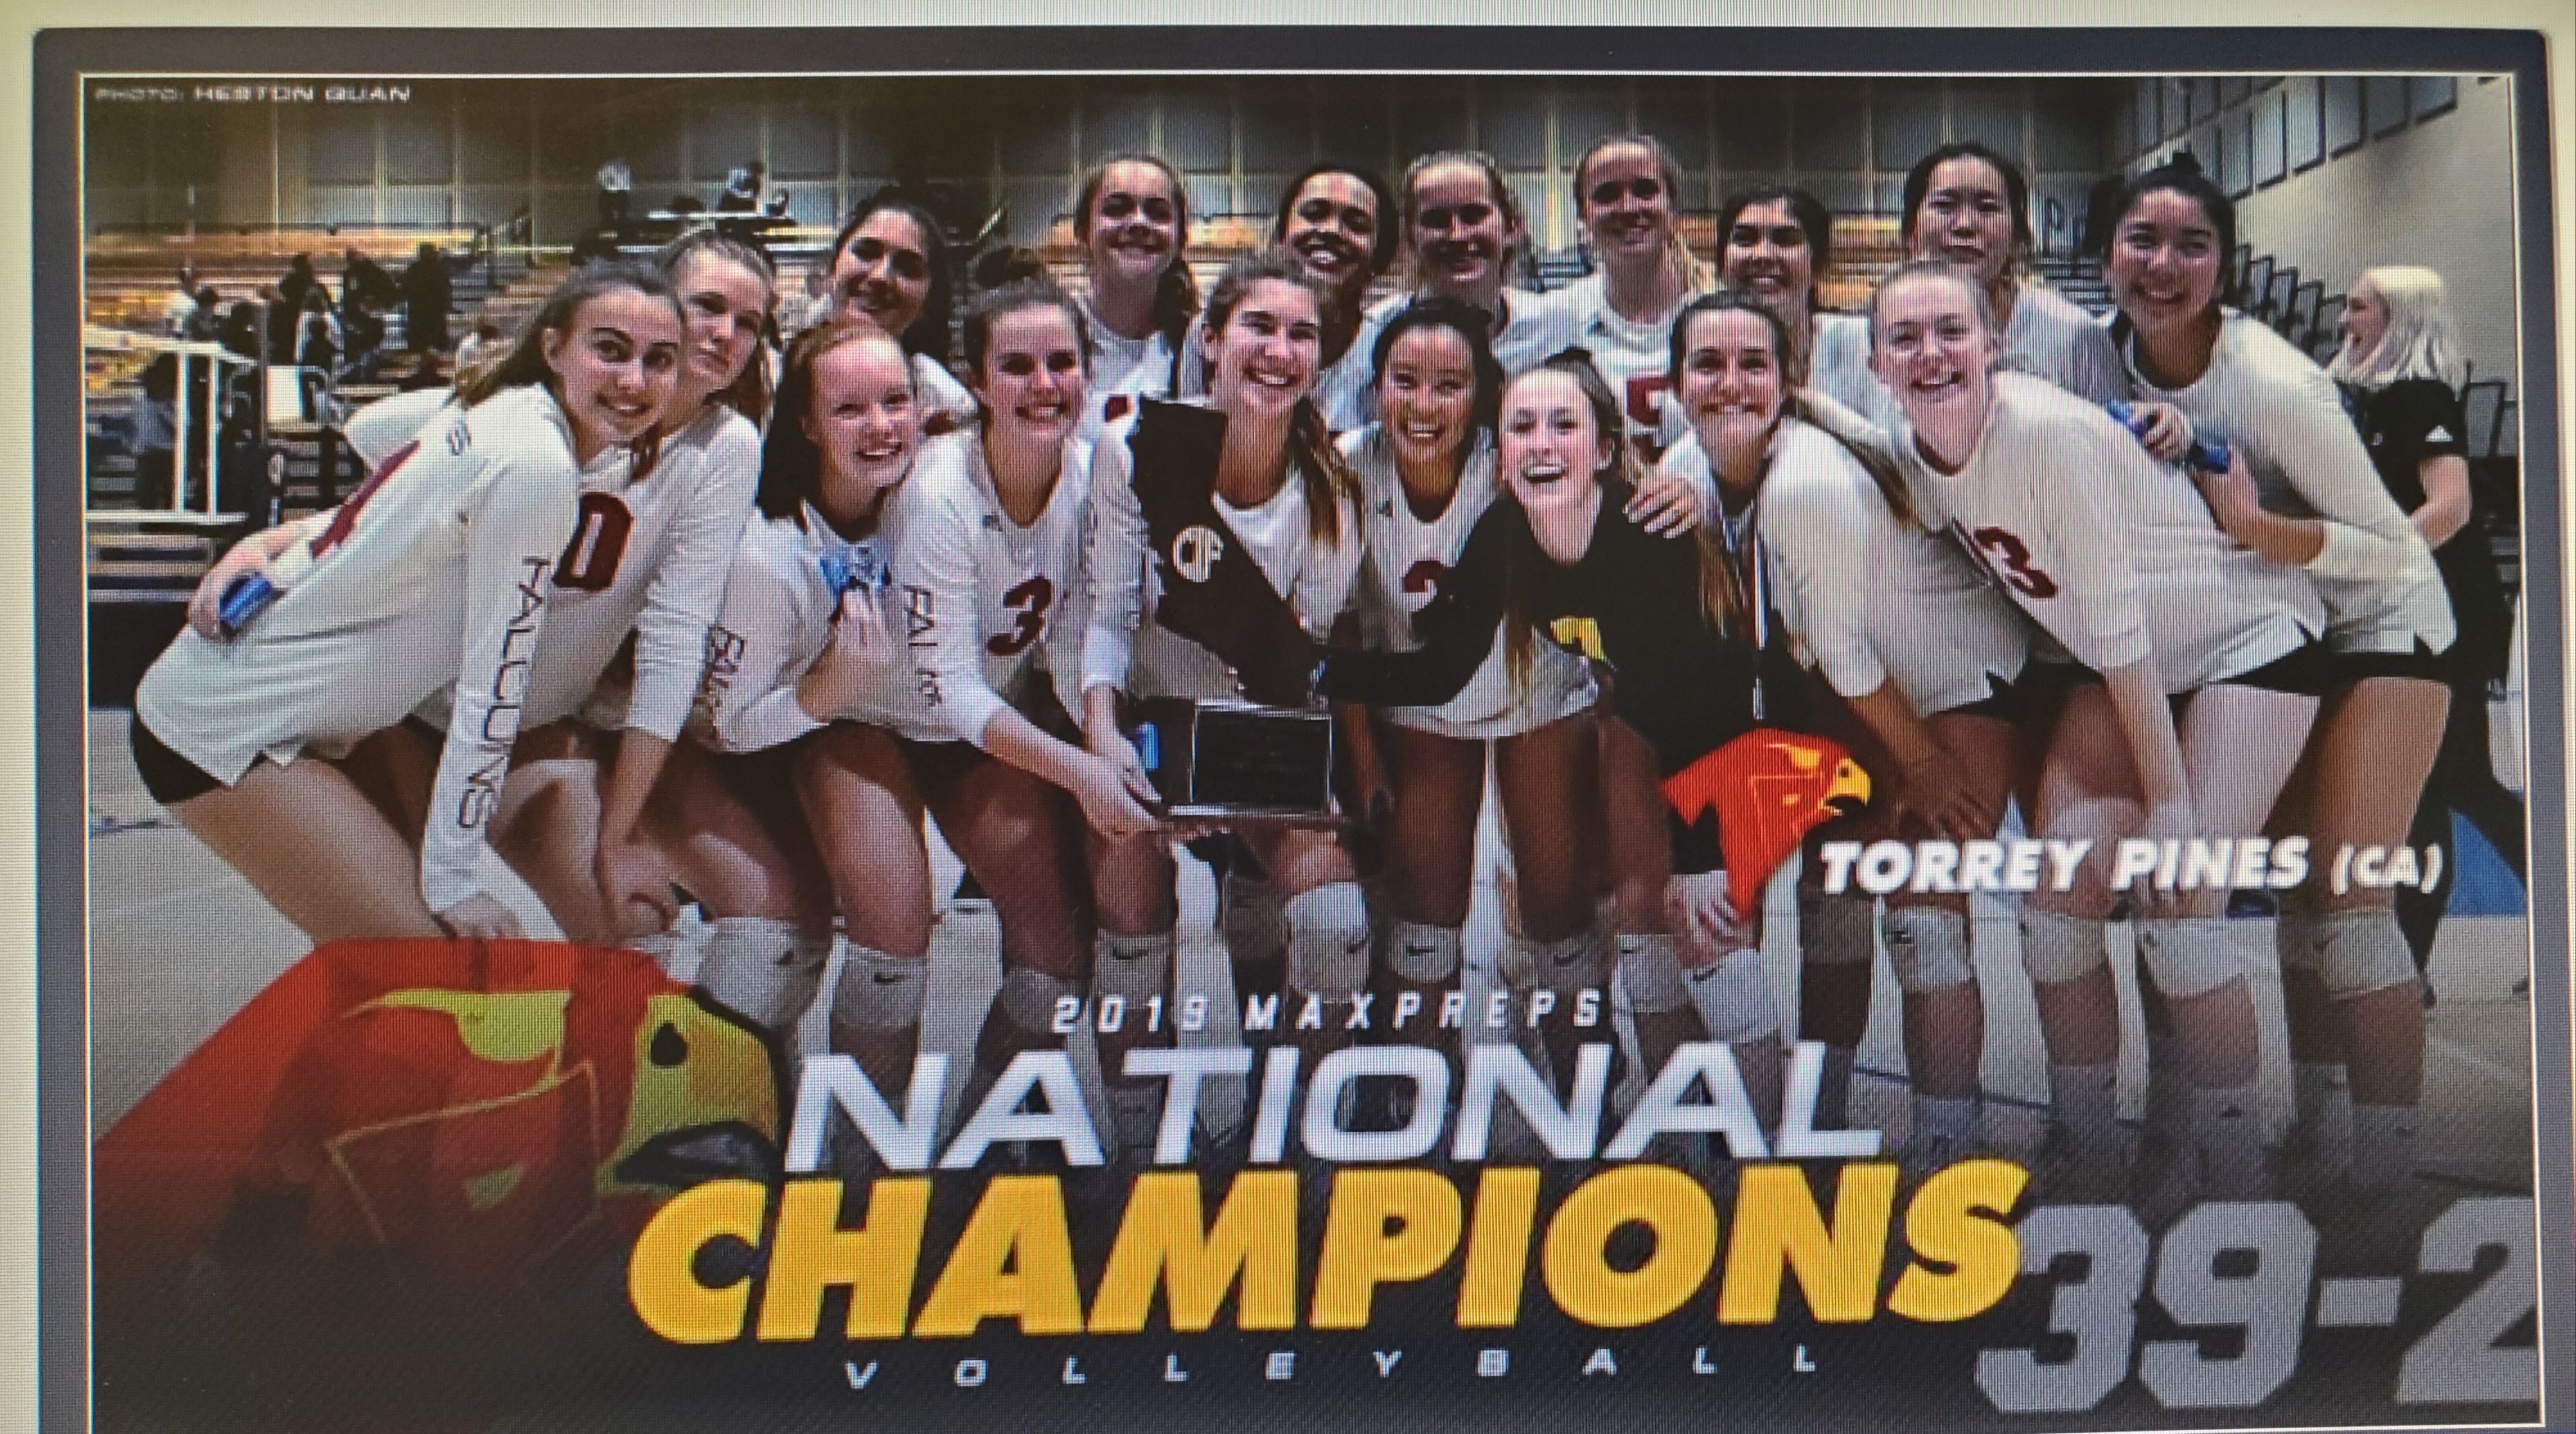
About 45 minutes after the Torrey Pines High School (TPHS, San Diego, CA) Girls Volleyball team beat Marin Catholic for the California State Title (CIF), the squad walked back into the lobby of the college gym where the match was held. The families of the players, including my wife and me, were waiting there to greet the girls following their straight sets victory on November 23. Shortly after their entrance, the tears of joy began to flow from players, Coaches and parents, as the energy in that foyer was so positive, loving, fulfilling and FUN! 

The hugs, high fives, pictures with the CIF State Champs trophy went on for a while. And then, the dancing began:    LINK  

As a Sophomore on the Varsity team, our daughter Hannah was treated well by everyone (see #3 below), got court time in some matches and played against the best in the country during their team practices. She, as did the other underclasswomen, learned a lot about the sport, but most importantly about what it means to be on a TEAM. A life lesson for being a part of a school, family, community, sports team and while giving back. 

TPHS Girls Volleyball TEAM is, as the father of an opponent said who we beat a week earlier, a “well-oiled machine”. And there is no coincidence/luck around how the girls did it. They did what great TEAMS do, to include the following: 

  1. Worked Hard: yes, they do have 7 girls who will play Division One College volleyball, but that didn’t stop them from laying it all out in practice and in matches. Yes, we all have to practice.
  2. Skills Focused: Hannah said her Coach told them whoever serves, passes and plays the best defense will win. They did, and they did. Never mentioned hitting or setting? 
  3. Leader Led without Egos: 5 Seniors in the starting 6, and 2 others on roster set the tone. It is about TEAM, not individuals. 3 Ivy League bound players were treated the same as the Sophomores…. no hierarchy. 
  4. Mindset & Belief: they knew they were excellent, took nothing for granted (as written on the back of their practice jerseys) and believed in themselves 
  5. Stick Together: high or low, on a hot streak or fighting to come back, they never wavered in their unity 
  6. Have Fun: they danced before and after matches, went to lunches together without Coaches, and spent time off the court hanging out. They like and trust each other, and it shows. 

As the cherry on top to a great season, a few days after the State Championship, three (out of four) of the top volleyball ranking organizations named them the Number One team in the country. Wow, it just was so wonderful, and has been a source of pride in their school and our community. 

In the end, it’s not necessarily about volleyball, or any sport. It is how we behave in the organizations that are part of our life. And this shining example is one that Hannah and her teammates will carry for the rest of their lives, on and off the court. Congratulations girls, we love you! 

This article is written by Dennis Hoeft, an experienced Sales & Marketing Executive with 30+ years experience leading, selling, managing and merchandising in highly competitive product and sales environments.  

Attending an industry conference is a costly endeavor: various factors such as transportation, lodging & meals can add up quickly. Add to that your time and effort, and well, that’s quite an investment! If you are planning to attend a conference this year such as PITTCON, it’s important to get the most out of these events in order to maximize the return on your investment. Here are 10 ½ tips to help you do just that:  

1) Plan well in advance; most conferences provide an exhibitor list as well as a list of attendees, so prepare a list of key people you want to meet. 

2) Several weeks prior to the conference, set up meetings with the key people you identified on your list; if you try to approach someone during the conference without an appointment, you might be out of luck if their calendar is already full. 

3) A few days before the conference, confirm the meetings that you have previously scheduled. 

4) Plan to spend some time ‘walking the floor’; attendees should spend this time looking for new and innovative exhibitors. Exhibitors should use this time to stay on top of their industry and find out what the competition is doing. 

5) Network; this is a great opportunity to make new contacts and expand your professional circle. 

6) Sit in on different seminars; try to learn something new about your industry or profession. 

7) Attend the various social events: dinners, cocktail hours, etc . . . meet new people, network, now is not the time to sit back & relax! 

8) Bring plenty of business cards to hand out; and, when you receive someone’s card, write pertinent notes about that individual on the back of their card immediately after you meet them. 

9) At the end of each day, do a quick re-cap to see if you accomplished what you set out to accomplish; adjust the next day’s schedule if you missed something important. 

10) When the conference is over, review your action items to make sure that you have captured & summarized all of them. 

And finally….  

10.5) When you get back to your office, FOLLOW UP, FOLLOW UP, FOLLOW UP! Address all of your actions items. Connect with new contacts on LinkedIn. Reach out by email and phone to build these relationships. Do what you said you were going to do.

You’ll be glad that you did!